 App Sales Dash
A native revenue dashboard for macOS
One dashboard for App Store, Google Play and Stripe revenue
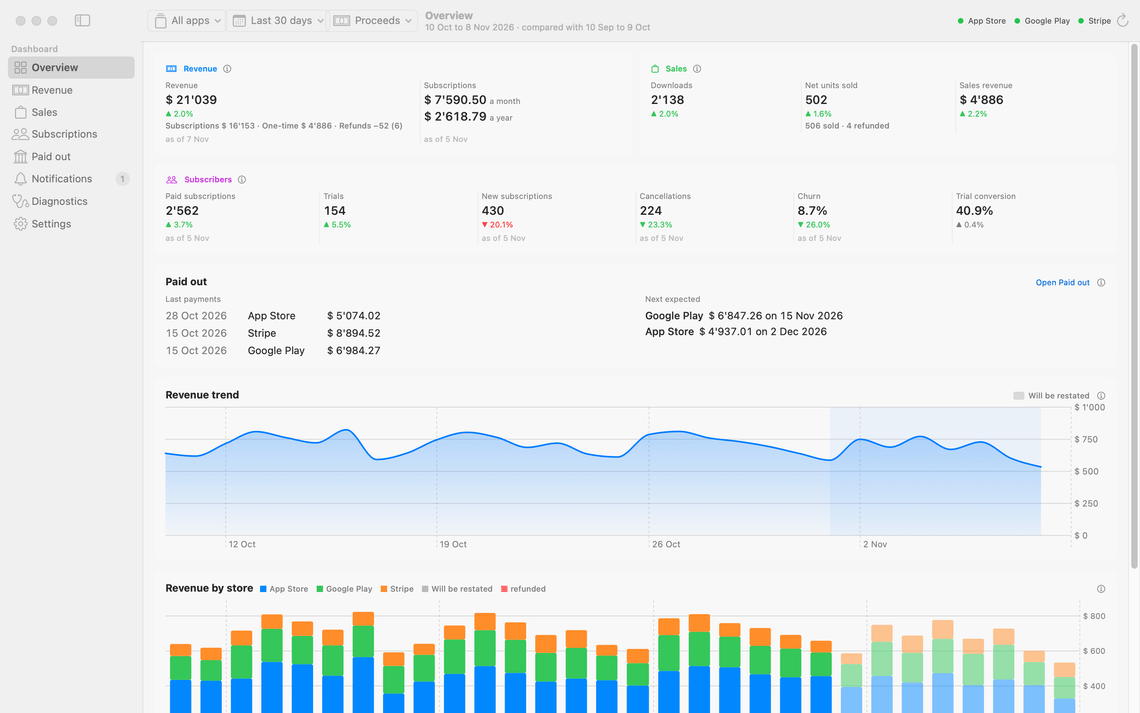
App Sales Dash reads your App Store, Google Play and Stripe reports straight from the stores and keeps everything on your Mac. Subscriptions, paid apps and one-time purchases count side by side, for one app or all of them. When settled figures replace early ones, Notifications names the change. Gaps are drawn as gaps, not zeroes. See every payment the stores made to your bank and export the statement your accountant needs.

Made for Macs running macOS 15 or later.
- Native macOS app
- Local data, no server
- No account, no analytics
- Read-only store connections
- Restatements announced
What it's for
Store dashboards disagree with each other, restate figures without a word, and none of them matches the bank statement on its own. App Sales Dash exists for the moment those numbers have to be accounted for. It consolidates all three sources into one local ledger with one set of definitions, for one app or all of them. Figures use your consolidation currency, by default the one your stores pay out in, converted at ECB daily reference rates.
See which days can still change: Revenue draws days the stores have not settled in a fainter shade. Days nobody reported are gaps, so you do not go hunting for a slump that never happened. A figure with nothing behind it reads No data, never 0. A quiet day inside a reported period reads 0, because that is what happened.
-
App Store
Apple's daily figures are estimates, and its settled total arrives weeks later, for a month that starts and ends mid-calendar. So an Apple number rarely matches the month you were asked about. App Sales Dash swaps in the final when it lands and states Apple's period in real dates, so you know which days a figure covers. The app also reads what your customers paid: first as an estimate, then as Apple's settled figure from the monthly report.
-
Google Play
Play's most recent days keep moving: its figures are estimates, and subscriber counts arrive a few days behind. A dip at the end of the month can be nothing but reporting that has not caught up. App Sales Dash shows which days can still change, so you can tell a quiet week from a late one. It also fetches the reports for you.
-
Stripe
Stripe reports payments as they happen, but they sit apart from your store numbers, counted a different way. App Sales Dash puts them beside the other two under one set of definitions, and its payouts are the quickest to find on your bank statement.
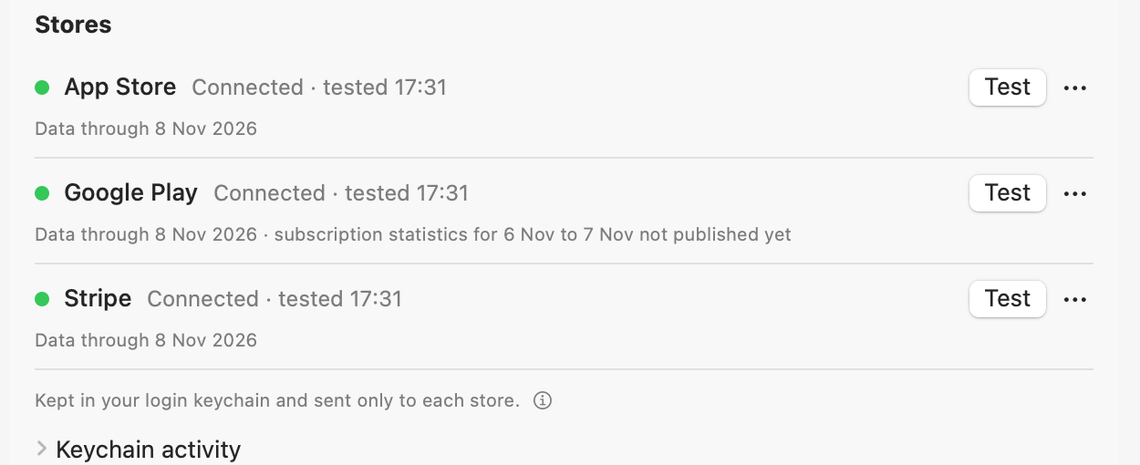
You connect each store once in Settings, and from then on the figures arrive on their own.
Feature overview
- One timeframe, every dashboard: set the period once for Revenue, Sales and Subscriptions.
- Revenue you can take apart: by store, plan, country and app, with subscriptions beside one-time sales.
- Sales and downloads: first installs, paid apps and one-time purchases, by country and app version where reported.
- One app or all of them: pick an app once and every dashboard follows.
- Refunds in plain sight: see the refunds inside your totals.
- Subscriptions in motion: paid subscribers, trials, cancellations, churn and conversion.
- What subscribers pay you: per billing period, from what each store actually paid.
- Plan names you recognise: use your own names instead of store identifiers.
- Restatements announced: Notifications names each store and period that changed.
- Paid out: every payment to your bank, with the next ones once their amount is exact.
- Statements for accounting: PDF and CSV for a month, quarter or year, for all stores or one.
- History kept: every report archived, past the year Apple keeps its own.
- A backup that is one file: your figures and reports in a single zip.
More than one app? Pick one, or see them all
A picker beside the timeframe offers all your apps, one app, or what is not assigned yet. Every dashboard follows it; statements cover the stores’ payments. The same app on the App Store and Google Play counts as one app. Name, merge or split your apps in Settings, and tell the app which Stripe prices belong to which product. From then on, which app carried the quarter is a one-click answer.
The Revenue screen
Revenue by store, plan and country
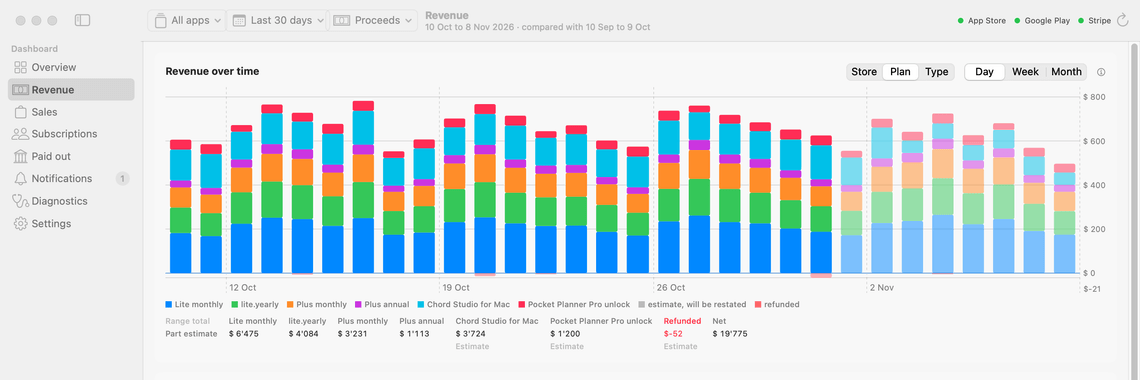
Revenue over any span you choose, split by store or by product, with a per-country table beside it. When someone asks which app carried the quarter, you pick that app and every dashboard answers, even when it sells on two stores.
What the store keeps shows the path from the customer’s price to what the store pays you, VAT and commission apart. Subscriptions sit apart from one-time sales. Downloads and sales have a screen of their own, so two hundred downloads and two purchases read as exactly that.
Refunds in plain sight
Your totals do not change, but you can see what is inside them. The Overview shows revenue including refunds and how many units came back. The Revenue screen shows what was refunded in its range total and draws refunds below zero in red. Statements show the payments, refunds and fees inside the payouts, where the store lists them.
The Subscriptions screen
Subscribers, trials and what they pay you
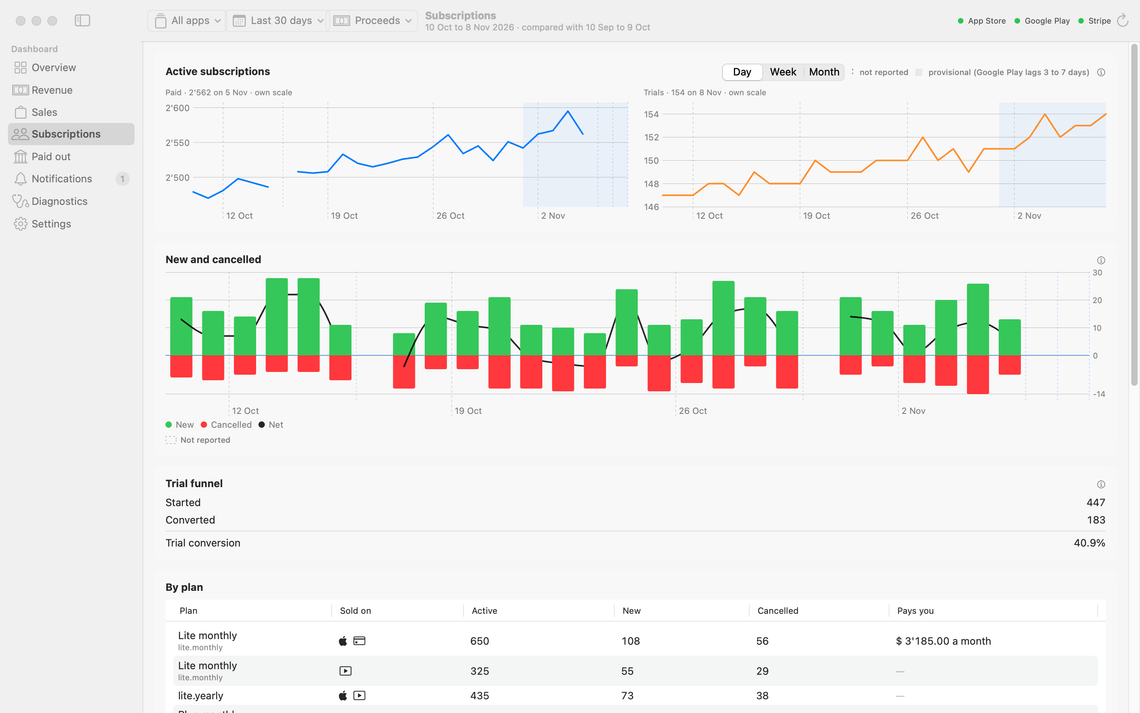
Follow paid subscribers and trials over time, compare people who started paying with cancellations, and read the trial funnel from started to converted. Free trials count under Trials until they convert.
By plan shows Pays you per billing period, from what each store actually paid. Plans and rates holds Plan names and What each subscriber pays. Exclude plan leaves a test plan out of every figure; Paid out and statements keep its money.
When something changes
Nothing changes quietly
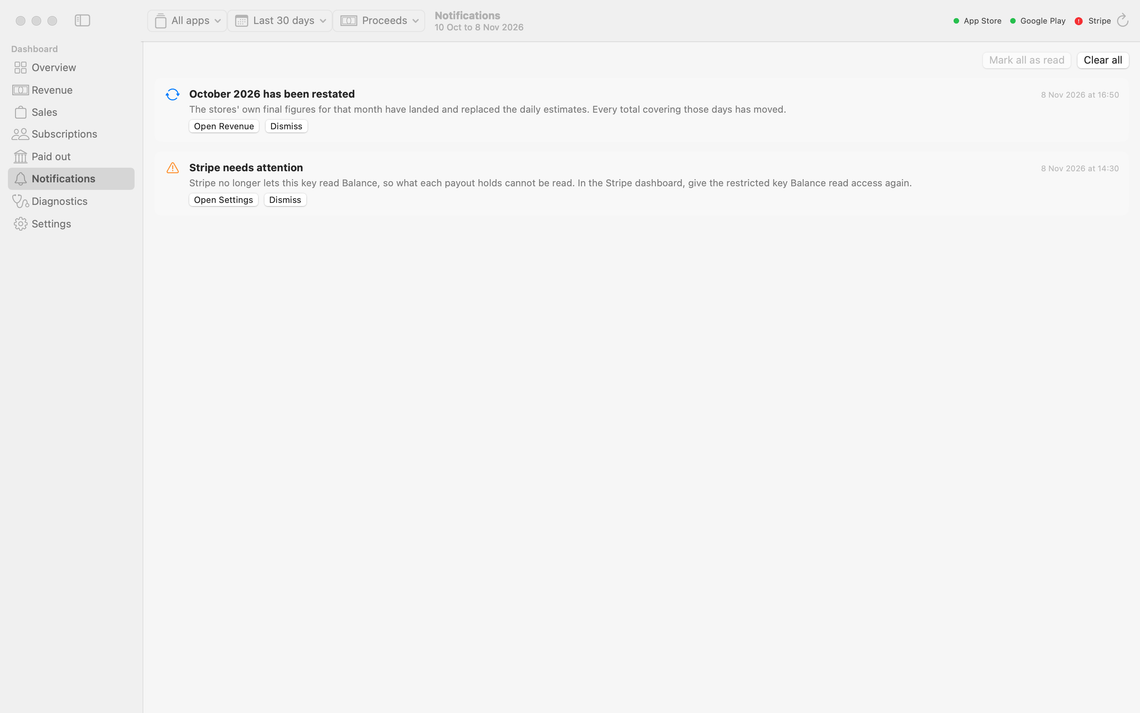
Notifications brings restated periods and stores that need attention into one list. Each restated store and period gets one card with Open Revenue.
A store that needs attention gets one card with its own failure text and Open Settings. The card goes when the store recovers.
The Paid out screen
Every payment to your bank, in one place
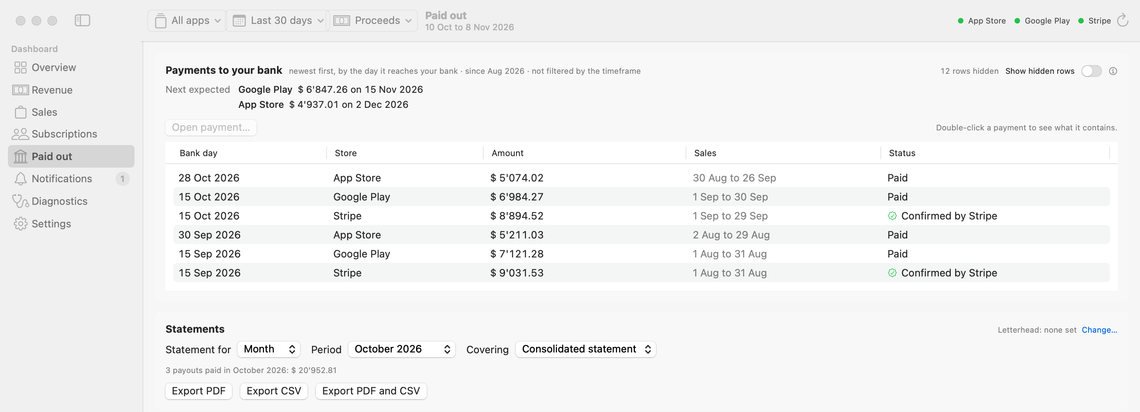
Payments to your bank lists every payment the stores made, newest bank day first, one amount each in your payout currency. Each shows its status, such as Confirmed by Stripe or Paid. Next expected shows coming payments once their amount is known to the cent.
Open a Stripe payout or an App Store payment to see the sales, fees and refunds inside it. Google Play’s payments are not itemised. Nothing is typed, matched or ticked off. The Overview’s Paid out card shows recent payments and the next ones.
Reading Revenue
See which days can still change
Days the stores have not settled are drawn in a fainter shade: their figures will be restated. Notifications announces when settled figures replace them. Days nobody reported are gaps, not zeroes.
A card has at most one (i), with a few short lines about its figures.
For your accountant
Statements for a month, quarter or year
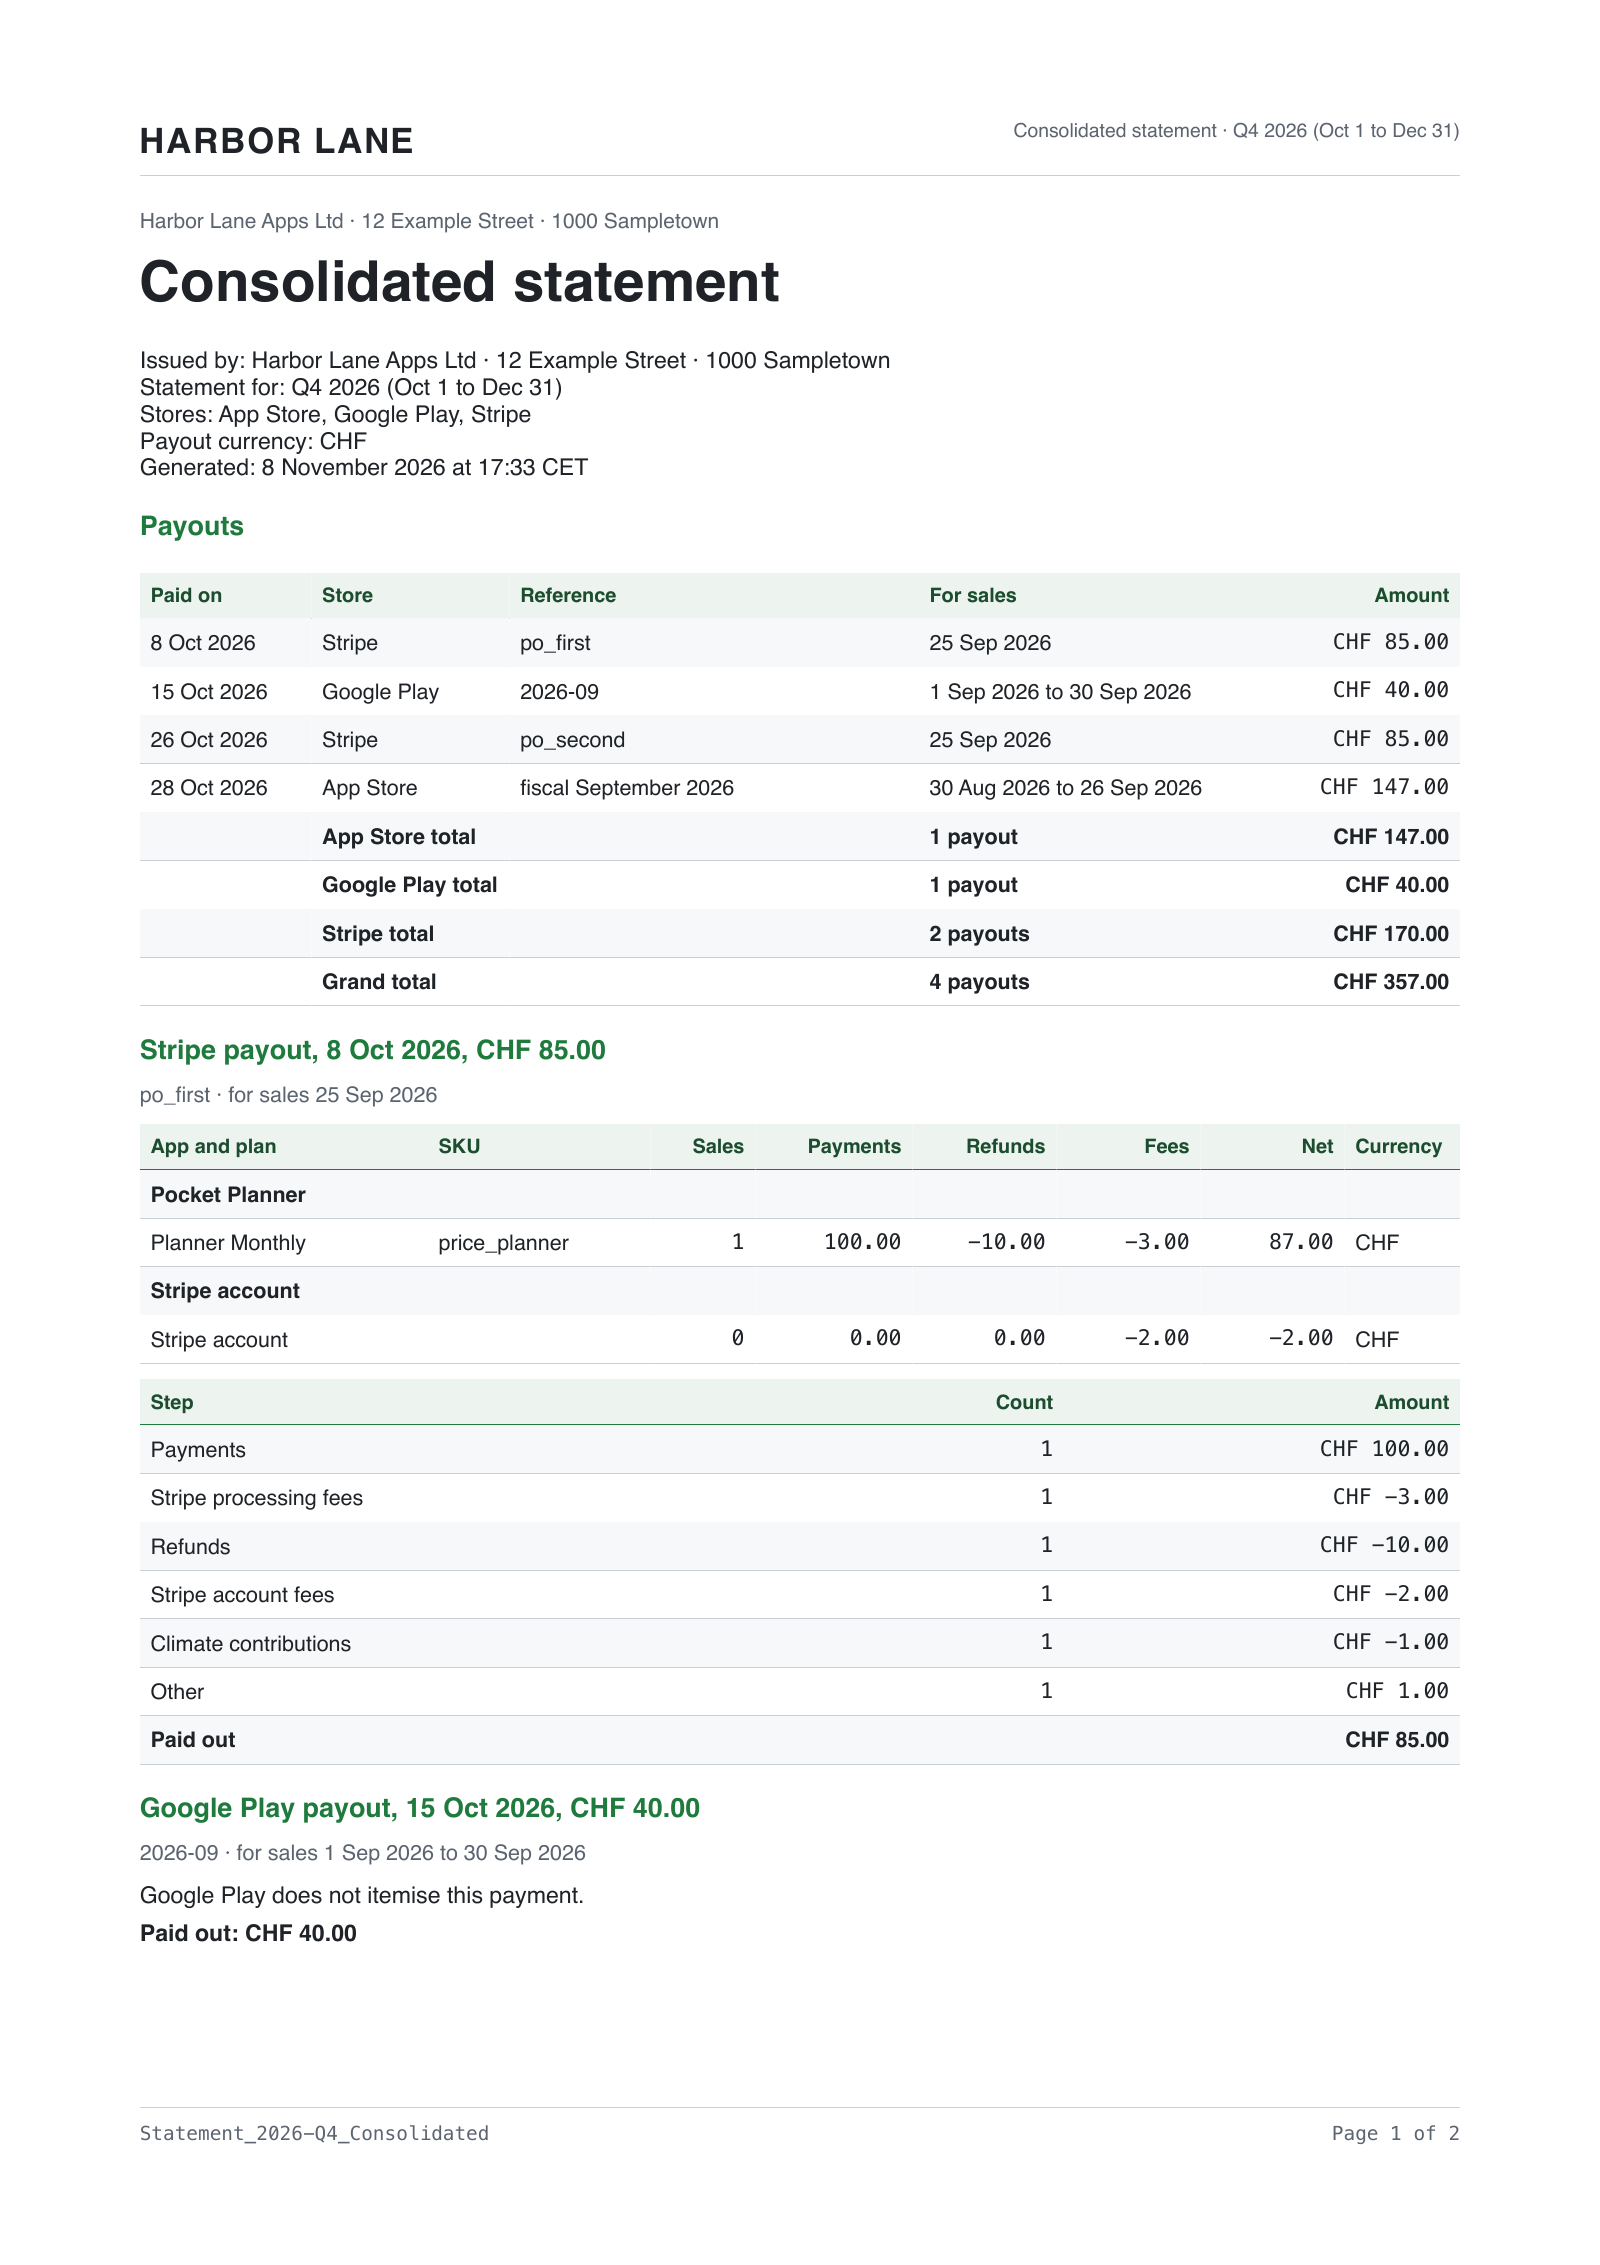
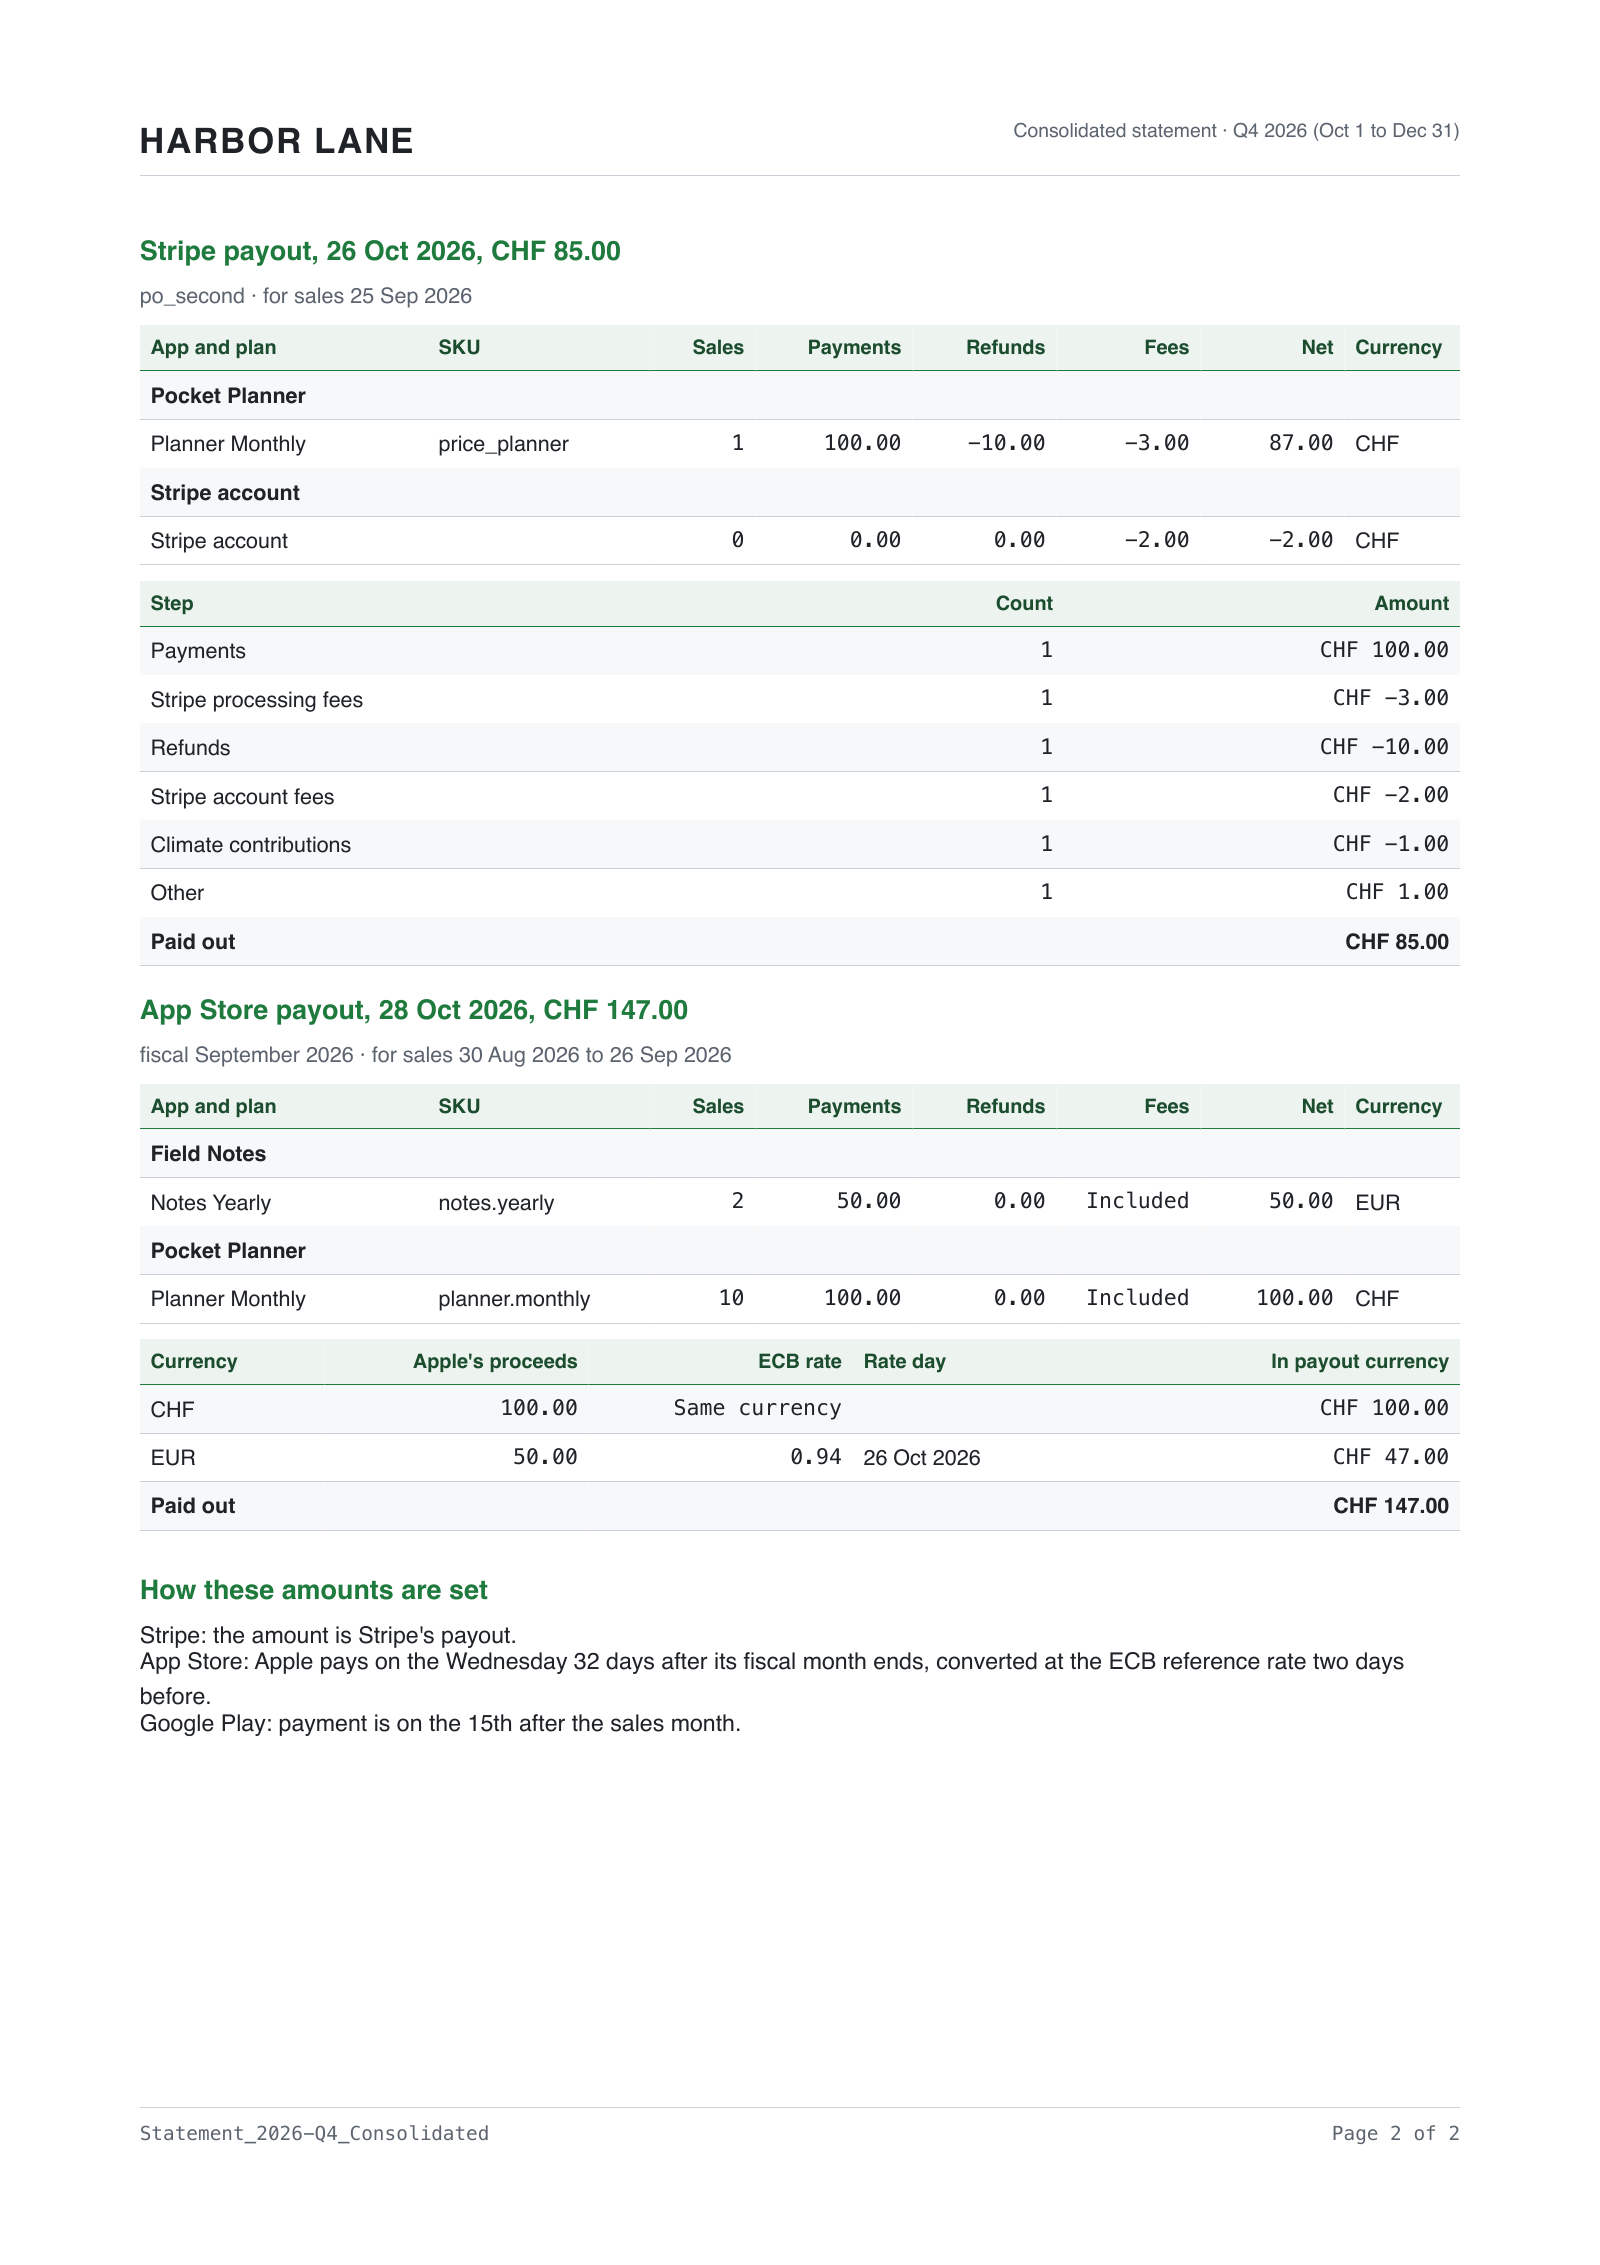
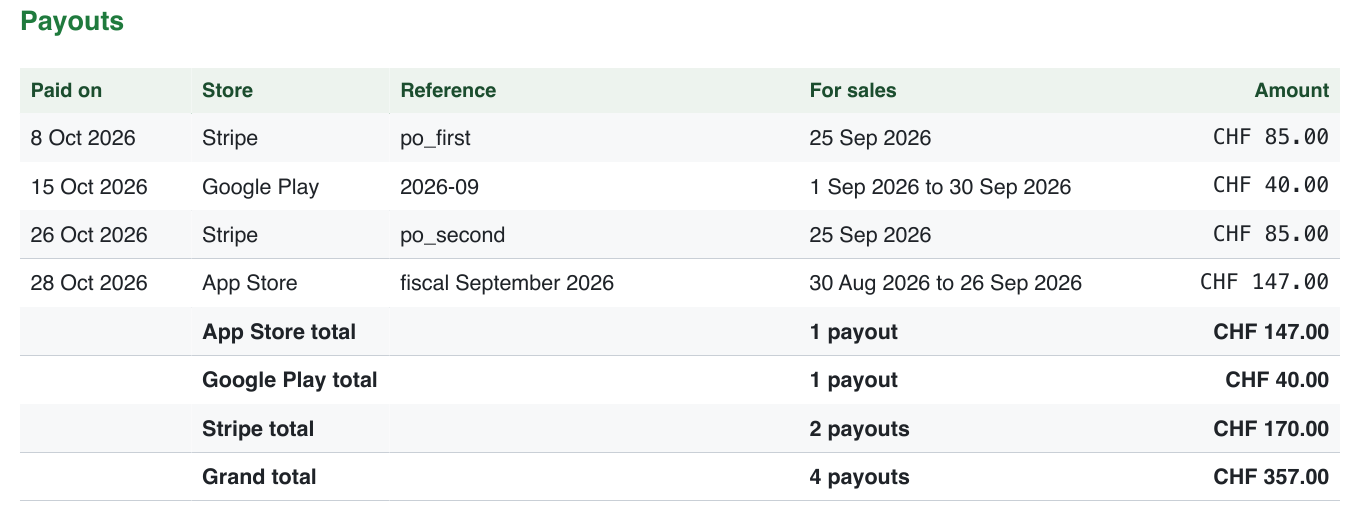
Choose a month, quarter or year and export the payouts paid in it as PDF and CSV. Cover all stores or one. Each payout lists its apps, plans, payments, refunds and fees where the store provides them, and a consolidated statement adds store totals and a grand total.
- All stores or one: consolidate the three stores or export one store’s payments.
- Payouts paid in the period: one amount each in your payout currency.
- What each payment holds: apps, plans, payments, refunds and fees where the store lists them.
- Totals you can follow: a total per store and a grand total on a consolidated statement.
- Your letterhead, or none: your company, address and logo on every page, and nothing of ours.
HARBOR_LANE_Statement_2026-Q4_Consolidated.csv
| Store | Paid on | App | Plan | Payments amount | Refunds amount | Fees | Net | Currency |
|---|---|---|---|---|---|---|---|---|
| Stripe | 2026-10-08 | Pocket Planner | Planner Monthly | 100 | -10 | -3 | 87 | CHF |
| Stripe | 2026-10-08 | Stripe account | Stripe account | 0 | 0 | -2 | -2 | CHF |
| App Store | 2026-10-28 | Field Notes | Notes Yearly | 50 | 0 | 50 | EUR | |
| App Store | 2026-10-28 | Pocket Planner | Planner Monthly | 100 | 0 | 100 | CHF |
Your data
Everything stays on your Mac
App Sales Dash stores its database and raw report archive on your Mac. There is no server, no account, and no analytics. Credentials go straight into the macOS Keychain and are sent to the three stores' own APIs and nowhere else.
Every store connection is read-only: the app can read your reports and can do nothing else to your store accounts. It writes nothing, anywhere, ever: the credentials it asks for cannot.
Who it's for
Solo developers
You sell one app on three stores, as a subscription, a paid download or a one-time unlock, and the only revenue picture you have is three dashboards that disagree. You want one figure per month, and to know when it is still going to change.
Small studios
A few apps, a few people, one person who does the books. Everyone runs the dashboard locally; the statements are what get handed over. Pick an app and every dashboard answers for it; hand over statements for one store or all three.
Whoever reconciles the payouts
You compare store payouts with bank statements. You need each payment’s bank day and amount, and a way to see what it holds.
Anyone doing this by hand today
You have been rebuilding this from CSV downloads every month. The app fetches, archives, normalises and restates so you stop doing it by hand.
Anyone who has reported a month and then watched it change
You have watched a store restate last month without a word. Here, Notifications names each restated period and opens Revenue.
How it's built
- Native macOS interface built with Swift and SwiftUI.
- Reports stay on your Mac. When an update reads them more accurately, changed figures are announced. Nothing is downloaded again.
- Settled store figures replace early ones, with a notification for each restated period.
- Figures in your consolidation currency, by default the one your stores pay out in, at ECB daily reference rates. Rows with no rate are excluded and counted, never converted at a guess.
- Read-only connections to all three stores; the app writes nothing to any store account.
- Credentials in the macOS Keychain, sent only to the stores' own APIs.
- Statement exports read one consistent snapshot, so a sync mid-export can never mix figures.
- Updates through the Mac App Store; requires macOS 15 or later.
App Sales Dash for Mac
Read your revenue, see your payouts and export statements, with your figures kept on your Mac.
App Sales Dash keeps its data and credentials on your Mac. No account is required.
Last updated